
Have you ever wondered how to visually represent the journey your customers take from initial interest to final purchase? Enter the pipeline funnel chart – a powerful tool in the world of sales and marketing. In this article, we will explore the ins and outs of this unique graphic, and how you can use it to increase your conversion rates and drive success in your business. Join us as we delve into the fascinating world of the pipeline funnel chart and unlock the secrets to building a successful sales funnel.
Table of Contents
- Understanding the Concept of Pipeline Funnel Chart
- Key Components and Benefits of a Pipeline Funnel Chart
- Best Practices for Building an Effective Pipeline Funnel Chart
- Optimizing Your Sales Process with a Pipeline Funnel Chart
- Utilizing Data Analytics to Enhance Your Pipeline Funnel Chart
- Advanced Strategies for Customizing Your Pipeline Funnel Chart
- Future Outlook
Understanding the Concept of Pipeline Funnel Chart

What is a pipeline funnel chart?
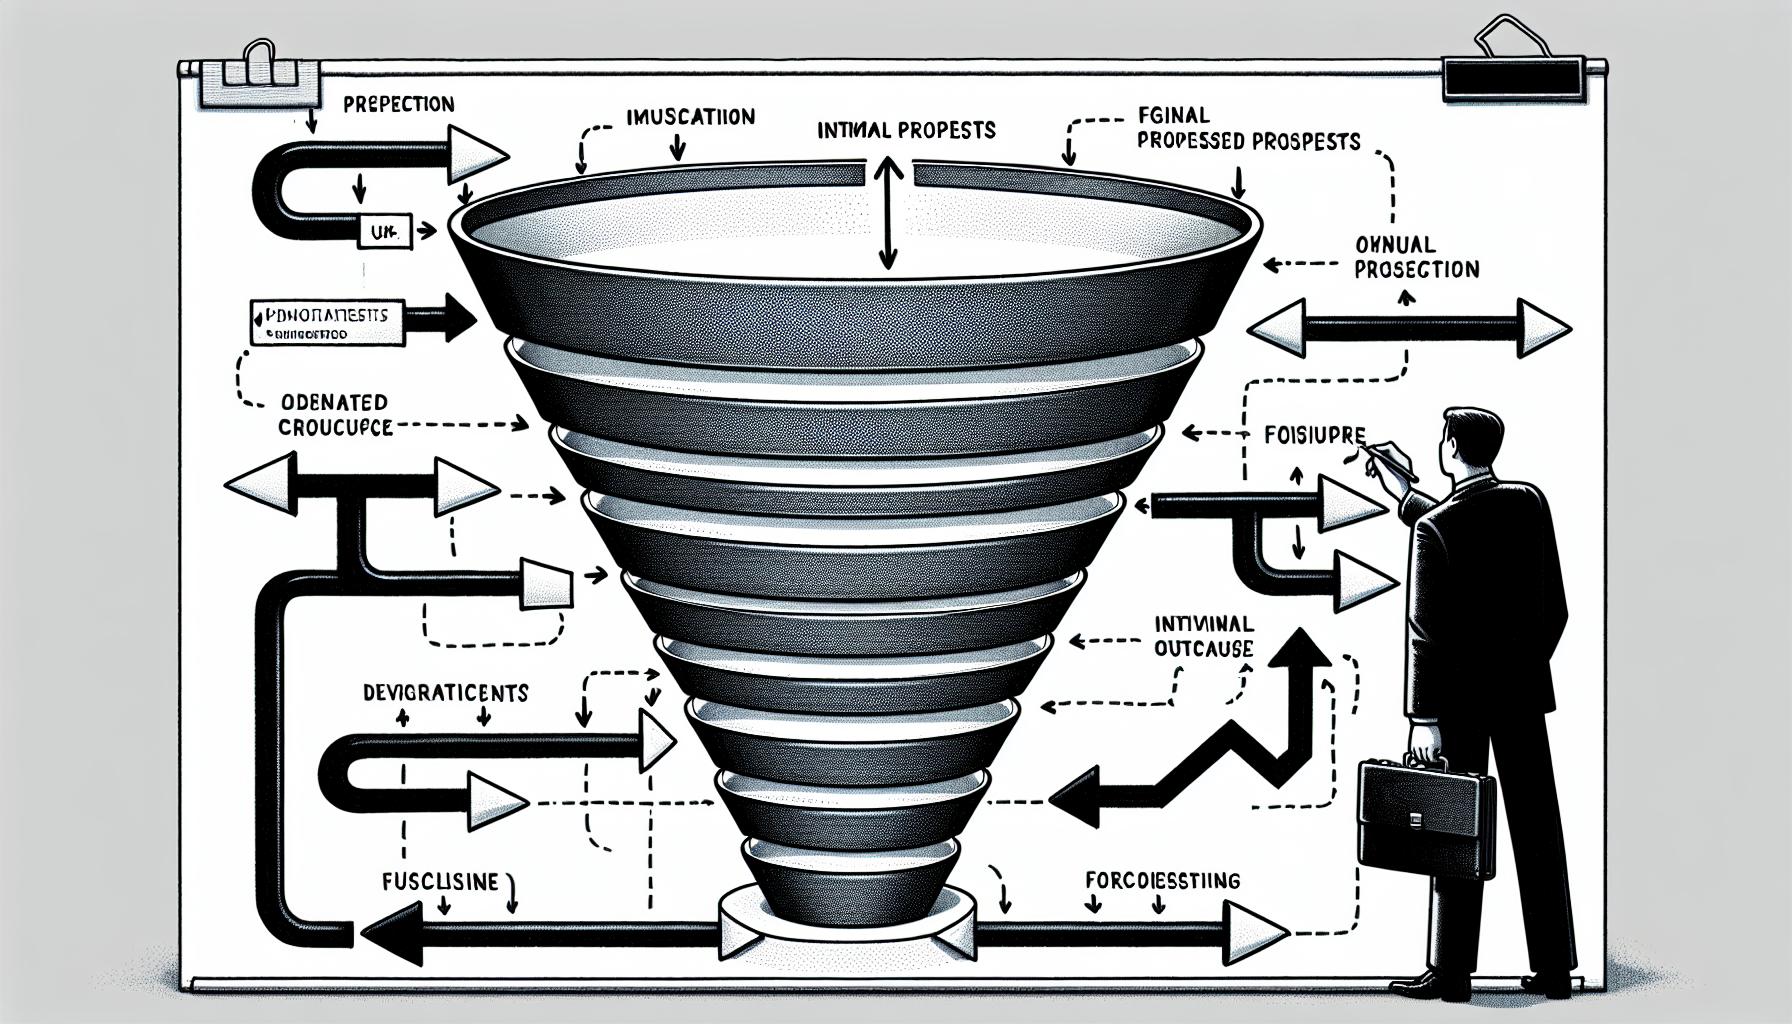
A pipeline funnel chart is a visual representation of the sales process, showing the progression of leads through each stage of the sales funnel. It helps sales teams track and analyze their sales pipeline, identifying areas for improvement and potential bottlenecks. The chart is typically divided into several stages, with different colors representing each stage of the sales process.
Some key features of a pipeline funnel chart include:
- Visual representation of sales pipeline
- Shows progression of leads through each stage
- Identifies areas for improvement
- Helps track sales performance
How to interpret a pipeline funnel chart?
Interpreting a pipeline funnel chart involves analyzing the width of each stage of the funnel to determine the volume of leads at each stage. A wider section indicates a larger number of leads, while a narrower section suggests fewer leads. By comparing the size of each stage, sales teams can identify where leads are getting stuck and focus on improving conversion rates. The chart also helps forecast sales revenue by estimating the number of leads that will progress through each stage of the funnel.
| Stage | Leads |
|---|---|
| Prospects | 100 |
| Qualification | 50 |
| Proposal | 30 |
| Closed Deals | 10 |
Key Components and Benefits of a Pipeline Funnel Chart
When it comes to visualizing and understanding your sales pipeline, a pipeline funnel chart is an invaluable tool for any business. This type of chart allows you to easily track and monitor the progression of leads through each stage of your sales process, providing a clear visual representation of your sales performance and potential areas for improvement.
The key components of a pipeline funnel chart include stages of the sales process, conversion rates, and the number of leads at each stage. By utilizing this chart, you can quickly identify bottlenecks in your sales funnel, optimize your marketing strategies, and ultimately increase your conversion rates. Some of the main benefits of using a pipeline funnel chart include:
- Visual representation: Easily see where your leads are in the sales process at a glance.
- Identifying problem areas: Quickly pinpoint where leads are dropping off and make necessary adjustments.
- Tracking progress: Monitor the flow of leads through each stage of the sales process over time.
Best Practices for Building an Effective Pipeline Funnel Chart
When it comes to building an effective pipeline funnel chart, there are several best practices that can help you optimize your sales process and drive better results. By following these tips, you can ensure that your funnel is structured in a way that maximizes conversions and keeps leads moving smoothly through each stage of the sales cycle.
- Define Your Goals: Before you start building your funnel, it’s important to clearly define your goals and objectives. This will help you determine what metrics to track and how to measure the success of your funnel.
- Segment Your Leads: Break down your leads into different segments based on criteria such as demographics, behavior, or engagement level. This will allow you to tailor your messaging and content to better resonate with each group.
- Automate Your Follow-ups: Set up automated email sequences and reminders to ensure that no leads fall through the cracks. This will help you stay in touch with prospects and nurture them throughout their buyer’s journey.
Optimizing Your Sales Process with a Pipeline Funnel Chart

When it comes to optimizing your sales process, a pipeline funnel chart can be a game-changer. This visual representation of your sales pipeline allows you to track the progression of leads through each stage of the sales process. By analyzing the data in the pipeline funnel chart, you can identify bottlenecks, optimize your sales process, and ultimately increase your conversion rates.
With a pipeline funnel chart, you can easily visualize the number of leads at each stage of the sales process, as well as the conversion rates between stages. This allows you to pinpoint areas where leads may be getting stuck or dropping off, and take proactive steps to address these issues. By , you can streamline your workflow, improve communication between sales teams, and ultimately drive more revenue for your business.
Utilizing Data Analytics to Enhance Your Pipeline Funnel Chart
Using data analytics to enhance your pipeline funnel chart can be a game-changer for your sales strategy. By leveraging the power of data, you can gain valuable insights that will help you optimize your sales funnel and increase your conversion rates. With the right tools and techniques, you can track and analyze key metrics to identify areas for improvement, fine-tune your processes, and ultimately drive more revenue for your business.
One way to utilize data analytics in your pipeline funnel chart is to segment your leads based on their behavior and engagement levels. By categorizing your leads into different stages of the sales cycle, you can create targeted marketing campaigns and personalized messaging that resonate with each group. This targeted approach can help you nurture leads more effectively, improve lead quality, and ultimately boost your conversion rates. Take advantage of tools like Google Analytics and CRM systems to track and analyze lead behavior, engagement rates, and conversion rates. By monitoring these KPIs, you can gain valuable insights into how your funnel is performing and make data-driven decisions to optimize your sales process.
| Metrics | Key Performance Indicators |
|---|---|
| Lead Generation | Conversion Rate |
| Lead Nurturing | Engagement Rate |
| Conversion | Close Rate |
Advanced Strategies for Customizing Your Pipeline Funnel Chart
In order to maximize the efficiency and effectiveness of your pipeline funnel chart, it is essential to implement advanced strategies for customization. One key tactic is to segment your leads into different categories based on their level of interest or buying intent. This allows you to tailor your marketing messages and follow-up actions accordingly, increasing the likelihood of conversions.
Another advanced strategy is to use color coding and shading in your pipeline funnel chart to visually represent the various stages of the sales process. For example, you can use bold, attention-grabbing colors for leads that are at a critical stage in the funnel, and softer, more subtle colors for leads that are still in the early stages. This not only makes it easier to quickly assess the status of each lead, but it also makes the chart more visually appealing and engaging for stakeholders. Ultimately, by customizing your pipeline funnel chart in these ways, you can streamline your sales process, improve communication with your team, and boost overall performance.
| Stage | Number of Leads |
|---|---|
| Top of Funnel | 200 |
| Middle of Funnel | 100 |
| Bottom of Funnel | 50 |
Future Outlook
And there you have it – a comprehensive guide on how to create and optimize a pipeline funnel chart for your business. By implementing this powerful visualization tool, you can better track and manage your sales processes, identify potential bottlenecks, and ultimately drive more conversions.
So what are you waiting for? Start building your pipeline funnel chart today and take your sales strategy to the next level. Happy funneling!